In an era where modern enterprises generate petabytes of information daily, the global data visualization tools market according to Coherent Market Insights is projected to reach USD 9.03 billion in 2026 and expand at a CAGR of 14.8% through 2033.
Despite this explosive growth, a persistent bottleneck remains: raw data is useless without context. Standard SQL scripts, static spreadsheets, and flat CSV extracts frequently fail to communicate complex operational realities to non-technical decision-makers.
To bridge the gap between complex datasets and strategic action, modern organizations are shifting away from static reporting toward dynamic, non-linear business intelligence platforms.
The Operational Challenge of Traditional BI
Traditional business intelligence platforms often force users down predefined, linear paths driven by strict SQL queries. If an analyst wants to uncover hidden correlations outside the pre-configured schema, they usually have to write a new query or request IT infrastructure modifications.

- Traditional BI Pipeline:
Traditional BI Tools→Linear SQL Query→ Pre-defined Visuals (Hidden connections lost) - Associative Data Pipeline:
Associative Engines→In-Memory Indexing→ Dynamic Data Discovery (All associations visible)
Modern analytics stacks address this limitation through three structural advantages:
- In-Memory Associative Indexing: Rather than querying tables sequentially, associative data models index every relationship within a dataset simultaneously. Unassociated data points remain visible rather than being filtered out by SQL joins, exposing unmapped anomalies and operational bottlenecks.
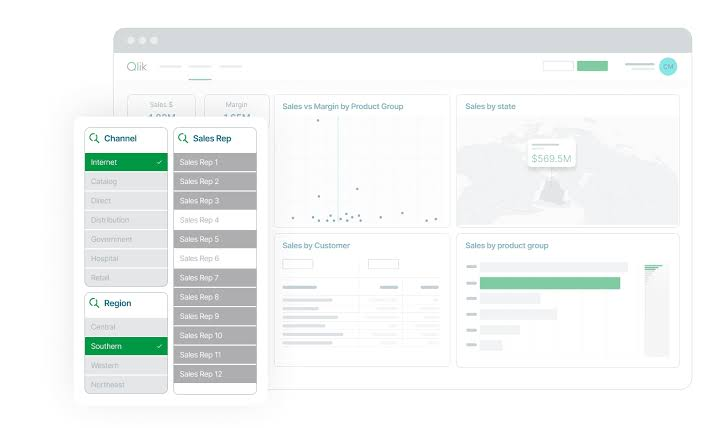
- Augmented Analytics & AI Assist: Advanced analytics suites now integrate natural language processing, automated visual recommendations, and native geo-analytics functions directly inside the data load script.
- Enterprise Recognition: Analytics platforms utilizing associative indexing—most notably Qlik Sense, which has been positioned as a Leader in the Gartner Magic Quadrant for Analytics and Business Intelligence Platforms for 16 consecutive years—remain a core fixture across global logistics, finance, and healthcare systems.
Key Technical Competencies in Modern Data Architecture
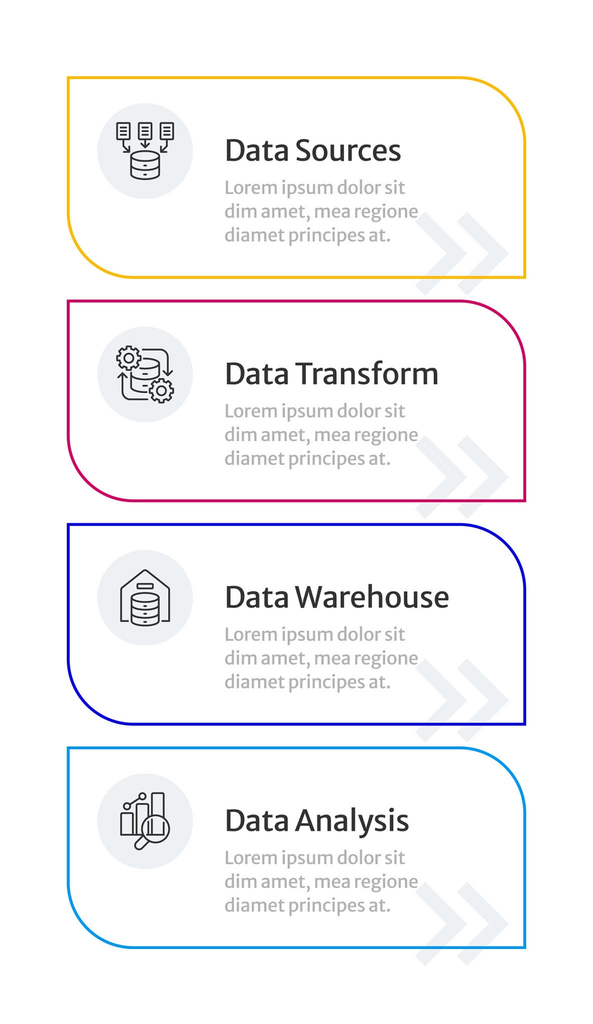
Transitioning from raw tabular data to interactive visualization requires mastering four core technical layers:
| Competency Layer | Legacy Approach | Modern Analytical Standard |
| Data Extraction | Manual spreadsheet exports | Automated load scripts & incremental data store refreshes |
| Logic Layer | Basic aggregations (SUM, AVG) | Advanced Set Analysis & dynamic state evaluation |
| User Experience | Static graphics & print reports | Responsive, multi-touch interactive dashboards |
| Data Security | Workbook file-level passwords | Dynamic, role-based Section Access security logic |
Architecting these pipelines enables organizations to shorten the feedback loop between data collection and executive execution.
Taking the Next Step in Your Data Career
Mastering the mechanics of data modeling, set analysis, and associative visualization allows engineers and analysts to transform complex, multi-source data into enterprise-ready visual pipelines.
If you are ready to put these principles into practice, build production-ready dashboards, and master associative data modeling, enroll in the Training Course in Data Visualization Using Qlik Sense. Gain hands-on experience in scripting, ETL pipeline design, and interactive dashboard composition to elevate your analytics capabilities.