
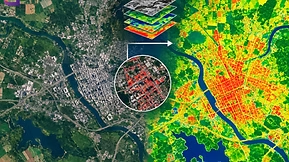
Kenya’s climate risks are increasingly spatial and localized, ranging from severe drought hotspots in the Arid and Semi-Arid Lands (ASALs) to acute flood hazards in Nairobi’s informal settlements. For practitioners in agriculture, disaster risk reduction (DRR), and Water, Sanitation, and Hygiene (WASH), geographic information systems (GIS) and earth observation data are no longer optional tools. Instead, they serve as the foundation for designing targeted adaptation projects, channeling resources efficiently, and proving impact to institutional donors.
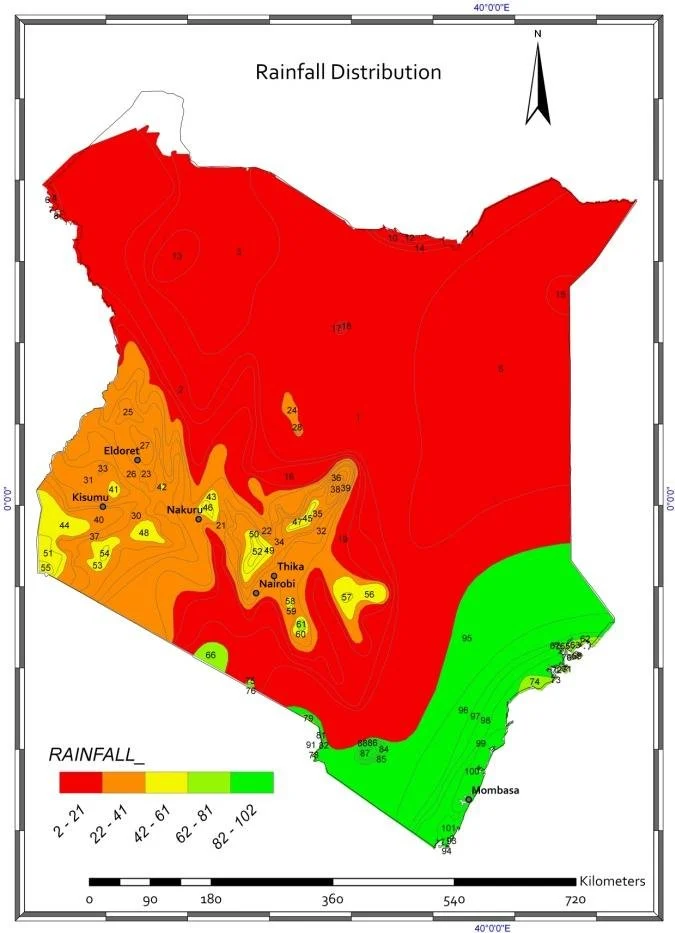
1. The Geospatial Data Landscape
Navigating Kenya’s climate data ecosystem requires knowing both global observational products and national access portals.
- Core Environmental Datasets: Practitioners monitor precipitation via CHIRPS, TRMM/GPM, and MERRA reanalysis data to calculate drought indices like the Standardized Precipitation Evapotranspiration Index (SPEI). Thermal infrared satellite sensors deliver Land Surface Temperature (LST) metrics to track heat stress. Meanwhile, Landsat, Sentinel-2, and MODIS offer Normalized Difference Vegetation Index (NDVI) and Normalized Difference Water Index (NDWI) layers to evaluate rangeland health and surface water availability. Digital Elevation Models (DEMs) supply the topography required for flood depth and landslide susceptibility modeling.
- Key Kenyan Platforms:
- Kenya Meteorological Department (KMD) Maproom: Delivers historical and real-time climate indicators mapped down to county and ward levels.
- Kenya Climate Change Knowledge Portal (KCCKP): Acts as a central repository for climate policies, strategic frameworks, and spatial layers.
- Kenya Space Agency (KSA) Data Hub: Provides accessible satellite imagery and spatial datasets specifically curated for national planning.
- County Climate Action Plans: Local governments (e.g., Marsabit, Kitui, Kakamega) host localized risk layers that frame regional development strategies.
2. Practical Applications Across Sectors
- County Adaptation Planning: Under the County Government Act, devolved units must integrate spatial data into their planning processes. For instance, the Marsabit and Kitui County Climate Change Action Plans (2023–2027) utilize participatory climate risk mapping to prioritize investments across livestock, water, and health sectors.
- Rangeland Management & Pastoralist Resilience: In northern Kenya, initiatives highlighted by Mercy Corps show how combining satellite imagery with local knowledge strengthens pastoral systems. Pastoral communities co-create digital maps tracking vegetation density and water points, directly guiding seasonal grazing plans and driving large-scale land rehabilitation.
- Agriculture & Food Security: Led by the Regional Centre for Mapping of Resources for Development (RCMRD) and the Ministry of Agriculture, the African Agriculture Adaptation Atlas (AAAA) provides spatial layers on changing Length of Growing Period (LGP) metrics. County teams leverage these insights inside dedicated GIS labs to plan crop diversification and drought-resistant livestock systems.
- Urban Climate Resilience: In Nairobi’s Mukuru informal settlement, long-term multi-spectral satellite analysis (1990–2025) tracked the expansion of impervious surfaces alongside NDVI loss. These spatial outputs directly guided the placement of upgraded drainage infrastructure and targeted green corridors to mitigate flash flooding.
- Infrastructure & Extractive Site Monitoring: Regional spatial studies and models available through UNES Geospatial Services highlight how Geo-Intelligence tools reveal shifting growing seasons. For example, forecasts indicate parts of Meru and Tharaka Nithi may lose 20 to 80 growing days during the March-May rainy season, whereas dryland zones gain days in the October-December window. Furthermore, as published in the African Journal of Land Policy and Geospatial Sciences, satellite monitoring around Lake Magadi demonstrates how NDWI tracking helps monitor environmental degradation near industrial and natural water resources.
3. Practitioner’s Corner: Tools and Workflows
To deploy geospatial analysis effectively within project design, technical teams generally rely on open-source and enterprise processing suites:
| Tool | Primary Purpose | Key Output |
| QGIS / ArcGIS Pro | Desktop spatial analysis, layer integration, and cartographic layout design | Implementation risk maps & spatial overlays |
| Google Earth Engine (GEE) | Cloud-based processing of massive satellite time-series data | Long-term NDVI/precipitation trend analysis |
| SNAP (Sentinel Application Platform) | Specialized processing of European Space Agency radar and optical data | Direct flood extent delineation & land-cover maps |
Standard Adaptation Project Workflow:
- Define the Spatial Scope: Frame clear geographic boundaries and target parameters (e.g., mapping smallholder drought vulnerability in Kitui County).
- Ingest Open Data: Download CHIRPS rainfall grids, Sentinel-2 vegetation indices, and local demographic layers from KMD, KCCKP, or global platforms.
- Execute Geospatial Analysis: Process trend anomalies in Google Earth Engine and execute weighted multi-criteria overlays in QGIS (e.g., overlaying drought frequency with poverty indices).
- Validate on the Ground: Verify remote sensing conclusions using ground-truth GPS sampling, community mapping, and household surveys.
- Generate Decision Products: Produce finalized risk maps, priority zone rankings, and spatial indicators for project proposals and monitoring frameworks.
4. Strategic Entry Points for NGOs
NGOs can maximize their operational efficiency and funding potential by aligning directly with existing spatial infrastructures:
- Align with Local Plans: Reference specific spatial priorities outlined in County Climate Change Action Plans when writing proposal baselines.
- Source from National Repositories: Pull existing datasets from the KCCKP and KSA Data Hub rather than recreating foundational layers, ensuring consistency with government data.
- Partner with Regional Hubs: Collaborate with institutional technical centers like RCMRD, local university geography departments, and county-level GIS units to share analytical workloads.
- Upskill Technical Teams: Invest in internal technical capacity by enrolling monitoring and evaluation (M&E) staff in hands-on courses, such as GIS and Remote Sensing in Agriculture, Food Security, and Climate Change Training Course.
- Implement Geospatial M&E: Track project progress over time using remote sensing metrics, measuring outcomes like vegetation recovery or flood risk reduction directly from space.
5. Implementation Challenges and Future Outlook
While geospatial technology offers immense clarity, practitioners encounter real-world operational bottlenecks. Data fragmentation across different agency portals often slows down acquisition, while significant GIS skills gaps persist within local government offices and smaller civil society organizations. Additionally, funding constraints frequently jeopardize the long-term maintenance of digital platforms after initial grant cycles conclude.
Looking ahead, the integration of artificial intelligence with satellite observation (Geo-Intelligence) will enable much faster, higher-resolution risk modeling across Kenya. As open-access portals become increasingly interoperable and county GIS laboratories mature, geospatial analysis will continue moving from an specialized technical field into the standard baseline for all climate programming.
Ready to Build Your Geospatial Skills?
To effectively bridge the gap between satellite data and on-the-ground impact, development professionals and NGO teams need practical, hands-on training. Enroll in the GIS and Remote Sensing in Agriculture, Food Security, and Climate Change Training Course to master spatial analysis, map production, and climate risk modeling for your organization.