Training Course in Data Analysis and Visualization Using Google Looker Studio
This 5-day hands-on course empowers professionals to turn raw data into clear, visual insights using one of the most accessible business intelligence tools on the market: Google Looker Studio (formerly Google Data Studio).
Course Overview
| Course Title | Training Course in Data Analysis and Visualization Using Google Looker Studio |
| Organization | Tech For Development (T4D) |
| Venue | Tech For Development (T4D) Training Center along Tala Road, Runda, Nairobi |
| Duration | 5 Days |
| Target Industries |
|
| Target Job Roles |
|
| Course Fees (Face-to-Face) | USD 1100/KES 75,000 (Exclusive of VAT) |
| Course Fees (Virtual) | USD 500/KES 55,000 (Exclusive of VAT) |
| Training Modes | Virtual and face-to-face training |
| Payment | Payment should be made to the Tech For Development (T4D) bank account on or before the start of the course |
| Accreditation | Tech For Development Certificate of Course Completion |
This 5-day hands-on course empowers professionals to turn raw data into clear, visual insights using one of the most accessible business intelligence tools on the market: Google Looker Studio (formerly Google Data Studio).
At the end of the course, you will be able to:
- Connect to multiple data sources like Google Analytics 4 (GA4), Google Sheets, and BigQuery
- Build visually compelling KPI dashboards with custom metrics, scorecards, and trend lines
- Use filters, controls, and drill-downs to enable self-service data exploration
- Apply dashboard design best practices to highlight patterns and support data storytelling
- Automate report refreshes and streamline report sharing with internal teams or external clients
All it takes is clear logic, thoughtful design, and the power of no-code business intelligence tools.
Who Should Attend this Course?
This training program is ideal for:
- Data Analysts
- Business Intelligence Analysts
- Marketing Analysts
- Digital Marketing Specialists
- Financial Analysts
- Growth & Product Managers
- Operations Analysts
- CRM & Retention Managers
- Sales Analysts
Course Requirements
- Basic familiarity with spreadsheets (Google Sheets or Excel)
- Understanding of basic metrics and reporting terms
- Google account with access to Looker Studio
- Sample data files (Google Sheets, CSV) for practice
- Stable internet connection
- Willingness to learn dashboard design principles
- Access to Google Analytics 4 or BigQuery for advanced practice (this is optional)
Course Modules
Course Outline
Module I: Introduction to Data Analysis & Google Looker
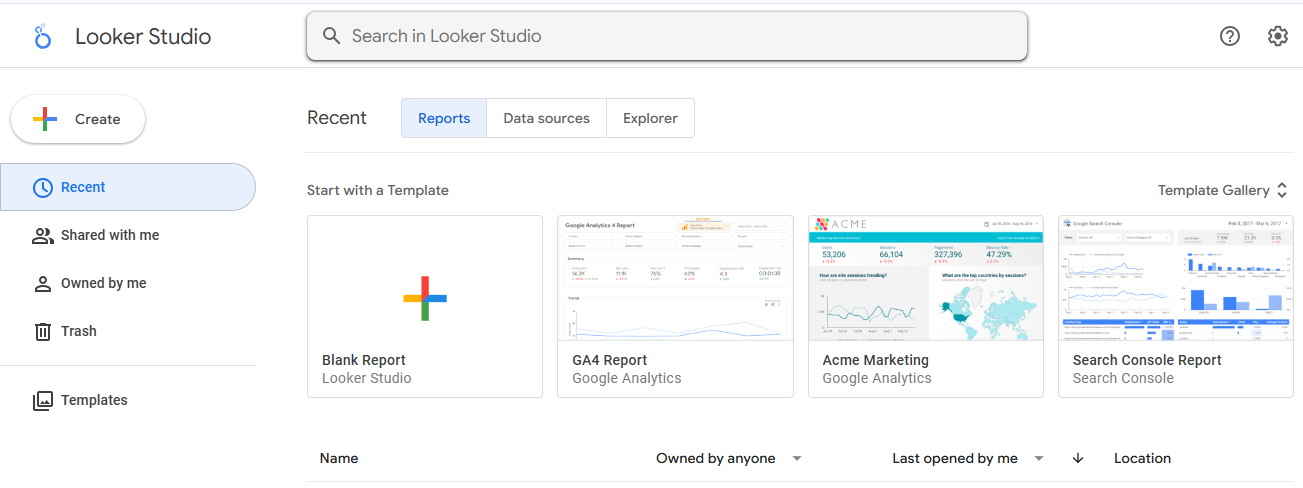
- What is Looker Studio? (formerly Google Data Studio)
- Understanding data analysis vs data reporting
- The role of BI (Business Intelligence) in decision-making
- Data types, dimensions, and metrics
- Overview of data sources: Google Sheets, BigQuery, GA4, CSVs, SQL databases
Training Approaches
- Tool walkthrough: Google Looker Studio UI
- Exercise: Connect a Google Sheet to Looker
- Group discussion: Real use cases for dashboards in business
Module II: Data Sourcing and Preparation
- Connecting to multiple data sources (GA4, BigQuery, Sheets, CSV)
- Using blended data vs. joined data
- Data transformation: calculated fields, filters, and date ranges
- Introduction to connectors and community visualizations
Training Approaches
- Hands-on: Connect at least two data sources to one report
- Practice: Create calculated fields for growth percentage, rolling average, etc.
- Group task: Prepare a clean dataset for analysis
Module III: Data Visualization and Dashboard Design
- Choosing the right chart for the right data (tables, bar, pie, combo, geo, time series)
- Dashboard UX principles: layout, color, hierarchy
- Creating interactive dashboards: filters, controls, drill-downs
- Designing for mobile vs desktop
Training Approaches
- Build: A full dashboard with filters and drop-downs
- Group review: Critique dashboards for clarity and effectiveness
- Practice: Rebuild a cluttered report using best practices
Module IV: Metrics, KPIs, and Customization
- Defining KPIs: leading vs lagging indicators
- Custom date ranges, goals, and benchmarks
- Using Google Looker scorecards, trend lines, and time comparisons
- Customizing themes, fonts, brand logos
- Sharing and permissions for stakeholders
Training Approaches
- Exercise: Set up marketing or sales KPIs in scorecards
- Hands-on: Apply custom styling to meet brand guidelines
- Role-play: Present insights to a client or team lead
Module V: Automation, Insights & Best Practices
- Scheduled reports and automated updates
- Embedding Google Looker dashboards on websites or intranets
- Tips for faster loading reports and performance tuning
- Data storytelling: turning charts into narratives
- Dashboard governance: consistency, access control, versioning
Training Approaches
- Group task: Automate a weekly report with email delivery
- Final project: Build a full report from source to story
- Peer feedback, wrap-up, and review
Course Administration
This instructor-led training course is delivered using a blended learning approach comprising presentations, guided practical sessions, web-based tutorials, and group work.
Accreditation
Participants will receive a Tech For Development Certificate of Course Completion.
Training Venue
Held at the Tech For Development Training Centre.
Accommodation & Airport Transfer
Arranged upon request.
Email: letstalk@techfordevelopment.com
Phone: (+254) 790 824 179
Tailor-Made
Customised training available.
Payment
Send proof of payment to letstalk@techfordevelopment.com.
Related Courses


Previous Participants
| # | Role | Organization | Country |
|---|---|---|---|
| 1 | - | - | - |
| 2 | - | - | - |